The Canvas API allows developers to draw 2D and 3D graphics in the browser using a <canvas> element. As it uses JavaScript, you can create interactive and animated graphics which any other logic in your application can also impact. The Canvas API is supported in nearly 98% of browsers but is quite verbose, which is where today's focus lies.
P5.js (from here 'P5') is a JavaScript library that makes working with the Canvas API much easier. Once included in a project, you are automatically given access to a set of global functions, variables, and lifecycle hooks. Instead of several long lines of code, most operations can be completed in a single function call.
Below is an example of a P5 sketch with only 20 lines of code. Try moving your mouse inside of it for some interactivity. The code for this example can be found here.
This is the first in a three-part series on learning P5, where we will cover the basics of drawing and interacting with a P5 'sketch.' Next week, we will cover many approaches used in creating games, and in the final part, we will integrate Deepgram into a sketch.
The P5 Reference is your friend and documents all of the variables and functions provided to your sketches.
Getting Started
On your computer, create a new directory and open it in your code editor. Create an index.html file and add the following to it:
<!DOCTYPE html>
<html>
<head></head>
<body>
    <script src="https://cdn.jsdelivr.net/npm/p5@1.4.1/lib/p5.js"></script>
    <script>
        function setup() {
        }

        function draw() {
        }
    </script>
</body>
</html>
setup() and draw()
P5 relies on two main functions to be written - setup() and draw().
Code in the setup() is run once when the program begins - initial and fixed settings are often declared here.
The draw() function is continuously run from top to bottom, defaulting to 60 times a second (this frequency is known as the 'frame rate'). Most of your logic will be written here.
The frame rate is a perfect example of a value you would set during setup() as you are likely to only do it once in an application.
To begin, create a new canvas on your page by adding the following lines to your setup() function:
function setup() {
    createCanvas(500, 500)
    background('red')
}
Load your index.html file in a browser, and you should see a large red square. This is your canvas which you can draw on - exciting! The createCanvas() function takes two arguments - a width and a height, which you have set to 500.
Colors In P5
In the current example, the background() function sets the entire canvas' background to red. Note that red is in quotes, as this is a CSS named color. There are plenty of other ways to define colors in P5 - try changing background('red') to any of the following:
// Red, Green, Blue - range of 0 to 255
background(233, 61, 69)

// Equivalent to 150, 150, 150 - will always be a gray
background(150)

// Hex codes work too
background('#38edac')
There are other ways to define colors - but these represent most of what you are likely to use. There are other contexts where colors are used beyond the background that will be covered later in this tutorial.
Reset the background to 0, which will result in black.
Drawing Shapes
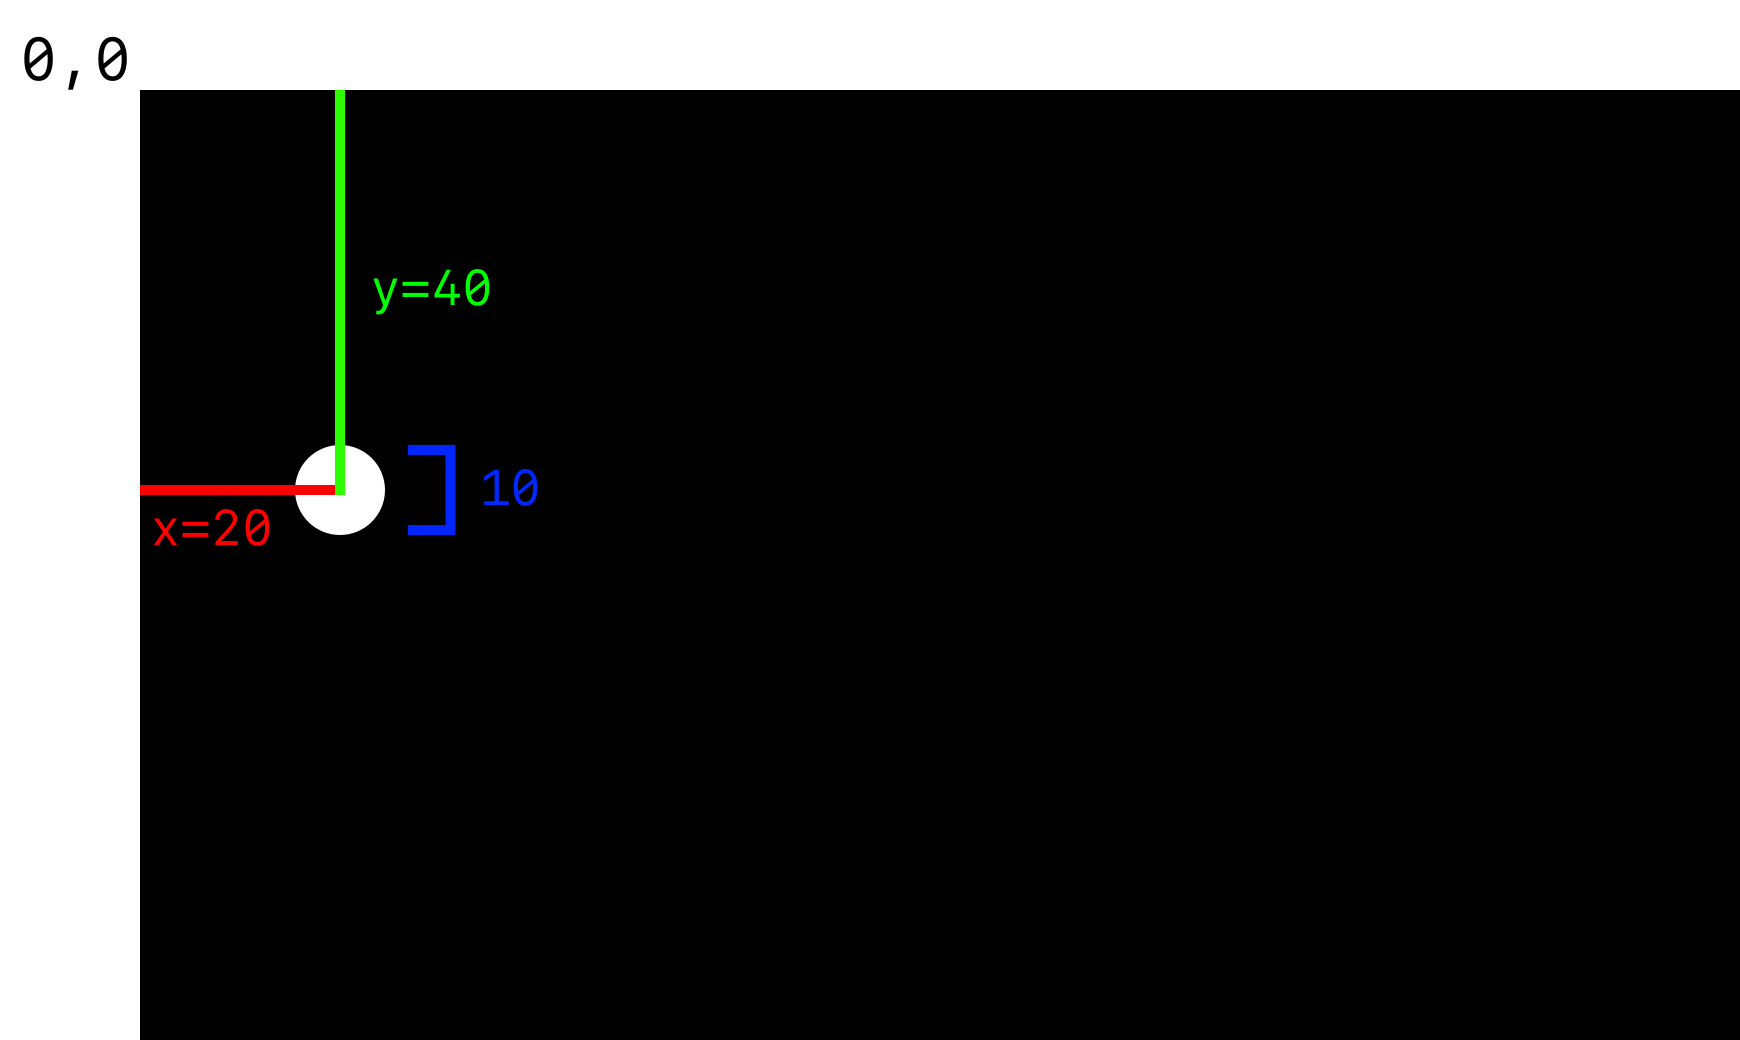
This canvas is rather lovely, and now is the time to draw elements on it. Before you draw anything, it's worth noting that the coordinate system sets the origin (0, 0) in the top-left. The first number always represents the x-axis (left to right), and the second number represents the y-axis (top to bottom).
Even though we are currently only drawing shapes once, it is recommended that you draw to the canvas in draw():
function draw() {
    circle(20, 40, 10)
}
Refresh your browser, and you should see a small white circle on the canvas. The three arguments for circle() indicate the x position, y position, and diameter. For circle(), the x and y values indicate circle's center.

Add a new square to your canvas and refresh your browser:
function draw() {
    circle(20, 40, 10)
    square(100, 100, 25)
}
The arguments for square() are the same as circle - x, y, and size. The only difference is that the (x,y) values are for the top-left corner of the square and not the center of the shape.
Add a rectangle to your canvas and refresh your browser:
function draw() {
    circle(20, 40, 10)
    square(100, 100, 40)
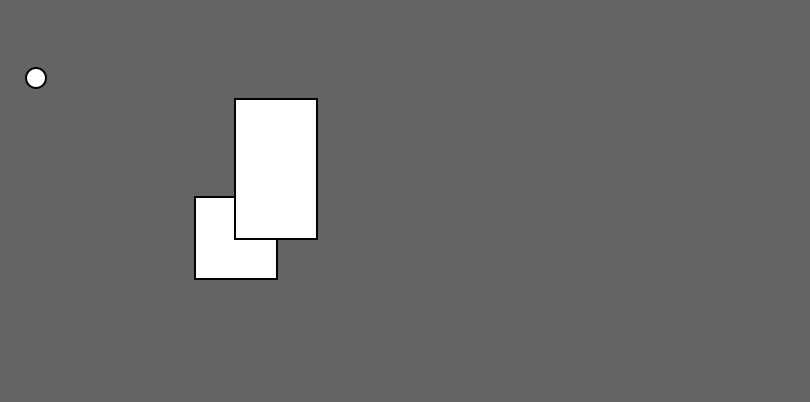
    rect(120, 50, 40, 70)
}
The rect() function's arguments specify the (x,y) of the top-left corner, the size of the shape on the x-axis (length), and the size on the y-axis (height).
These values cause the square and rectangle to overlap, and for the first time, you'll see that all of the shapes so far have a black stroke (border) around them. Change the background() argument in setup() to 100 to see this more clearly.

There are a range of other shapes to use, including triangle(), ellipse(), line(), and quad(). All work similarly, though the exact number of arguments may be different. Take a look at the P5 Reference for more information.
Setting Fills & Strokes
Statements in P5 run in the order they are written, and elements 'drawn' are done in that order. If elements overlap, ones drawn afterward will appear 'on top,' as the other element has already been placed. If you want to see this in action, temporarily swap the square() and rect() statements to see the difference.
You need to understand that the order of statements is important to control the colors of elements. Colors aren't set when drawing an element, but instead, use their own set of functions provided by P5.
Update draw() to the following and refresh your browser:
function draw() {
    fill('red')
    stroke('blue')
    circle(20, 40, 10)
    square(100, 100, 40)
    rect(120, 50, 40, 70)
}
All of the shapes are now red with a stroke of blue as the fill() and stroke() values are applied until it is unset or set to something else. Try this:
function draw() {
    fill('red')
    circle(20, 40, 10)
    square(100, 100, 40)
    fill('green')
    rect(120, 50, 40, 70)
}
Now the first two shapes are red, but the third is green. Finally, try this:
function draw() {
    circle(20, 40, 10)
    fill('red')
    square(100, 100, 40)
    fill('green')
    rect(120, 50, 40, 70)
}
You may have expected the circle to be its initial white color, but instead, it's green. Why is this?
Persistence Between Draws
The draw() function executes statements from beginning to end, and once completed, it starts again and repeats endlessly. The steps of 'draw a circle, then a square, then a rectangle' are happening thousands of times a second, but you can't see it because the steps are happening in the same order and in the same positions.
Functions that apply settings to the canvas are not reset between draws. Because of this, the fill('green') run is still the most recent fill() every time after the first draw. We'll get to see this more clearly later in this post.
Moving Elements
Because of variable scoping in JavaScript, any variables created in draw() are recreated with their initial value every frame:
function draw() {
    let frame = 1
    frame += 1
    frame // is always 2, regardless of how many times draw() runs
}
Instead, persistent variables should be defined in global scope. Try this:
let frame = 1
function draw() {
    frame += 1
    circle(frame, 40, 10)
}
The first argument in circle() is now the value of frame. Here's what it looks like:

The circle is not being moved every frame, but a new circle is being drawn on the existing canvas. When the circle goes off-screen, there are just over 500 circles visible. It is common to redraw the whole canvas background at the beginning of draw() to 'wipe' the canvas:
let frame = 1
function draw() {
    background(100)
    frame += 1
    circle(frame, 40, 10)
}
User Input
Mouse Input
All of the P5 functionality we've used so far is in the form of global functions, but there are also many global variables provided for use in your sketches. Try this:
function draw() {
    background(100)
    if(mouseIsPressed) {
        fill('red')
    } else {
        fill('white')
    }
    circle(mouseX, mouseY, 10)
}
This small snippet effectively shows off three variables:
mouseIsPressedistrueif a mouse button is pressed.mouseXis the position of the mouse on the x-axis.mouseYis the position of the mouse on the y-axis.
It's also worth knowing that the mouseButton variable will hold the last pressed button - either LEFT, RIGHT, or CENTER.
Keyboard Input
Just like mouseIsPressed, there is a keyIsPressed variable. Like mouseButton, the key variable will hold the last-pressed key. We can combine this to control the position of elements:
let circleX = 250
let circleY = 250

function draw() {
    background(100)

    if(keyIsPressed) {
        if(key == 'ArrowLeft') circleX -= 1
        if(key == 'ArrowRight') circleX += 1
        if(key == 'ArrowUp') circleY -= 1
        if(key == 'ArrowDown') circleY += 1
    }

    circle(circleX, circleY, 10)
}
Drawing Text
There are a bunch of typography-related functions provided by P5 which you can read more about in the P5 Reference, but to focus on the two most important, try this:
function draw() {
    background(100)
    fill('white')
    textSize(24)
    text('Current frame is ' + frameCount, 100, 100)
}
textSize() changes the font size - the default is 12. text() takes three arguments - the text to display, and the (x,y) frameCount is a built-in variable which goes up by 1 every time draw() is run.
Drawing Images
There are two sets to drawing images - loading them, and displaying them. We also want to make sure it is fully loaded before showing it.
Up until now, we have used setup() and draw(), but one of the other lifecycle functions with P5 is preload(). preload() loads in external files fully before setup() is run, and this is where we will load images. Try this:
let catImage
function preload() {
    catImage = loadImage('https://placekitten.com/200/100')
}

function setup() {
    createCanvas(500, 500)
    background(100)
}

function draw() {
    background(100)
    image(catImage, 10, 20)
}
The image will load in at its full size, so if the image is 300 pixels wide, it would use up 300 pixels on the canvas. You can optionally provide two more to set the width and height explicitly:
image(catImage, 10, 20, 100, 100)In Summary
That was a lot, and we're just warming up. We covered lifecycle functions (preload(), setup(), and draw()), setting colors, the P5 coordinate system, drawing shapes and text, basic animation, interacting with elements through a keyboard and mouse, and finally loading and showing images.
In next week's post, we'll cover how to build several games-related features in your P5 sketch, and in the third and final post, we'll integrate Deepgram into a P5 sketch.
If you have any questions, please feel free to reach out to us on Twitter at @DeepgramDevs.
If you have any feedback about this post, or anything else around Deepgram, we'd love to hear from you. Please let us know in our GitHub discussions .
More with these tags:
Share your feedback
Was this article useful or interesting to you?
Thank you!
We appreciate your response.


